THE GREAT EIGHT

EG#1 - DIGITAL DASHBOARD

In the 2020s, it wouldn’t be all that unusual to have 5 TV screens dotted around the house, but you wouldn’t expect to have each one only able to show one channel would you? So what’s the point of having multiple different website browsers open all the time to give you feedback on how you are doing?

A mobile and mac display of ICN SQUID's Digital Analytics Display
ICN SQUID Data Management Display

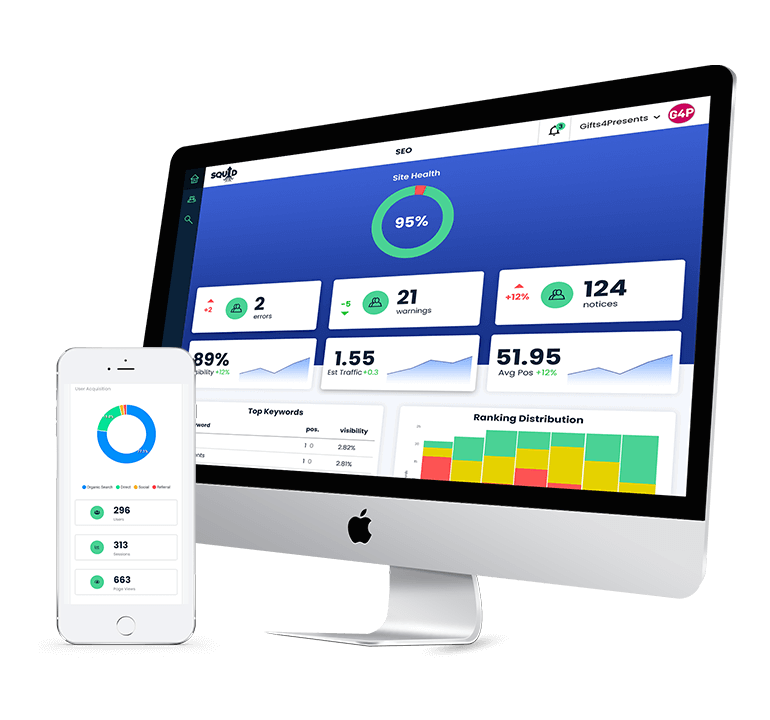
From just one browser window, you are able to see up to date information from Google Analytics, Facebook, Twitter, Instagram, SEO data and Flurry App Analytics in a variety of easy to view perspectives, from an overall headline picture, to specialist, more in depth assessments for areas like social and SEO performance.

You are also able to download reports and export data – part of EG#3 Management Reporting, so you should be able to save time pulling stats together for internal and external reporting or client feedback.

The Digital Dashboard is free to ICN clients in 2021.

What’s coming soon for the Digital Dashboard?

We will be adding software intermediaries (called API’s) with YouTube, LinkedIn, TikTok and Pinterest so you can add view more of your digital footprint at a glance, in one place.

We will be also be adding Hints and Tips on how best to interpret the data and what questions to ask next in terms of making improvements.

It will also be incorporated into EG#7 the ICN SQUID App, which is set for release on 27 May, 2021

Interested?

Fill out the form on this page to get in contact with one of our advisors, and we’ll get back to you and see what we can do! We look forward to hearing from you.